Cy Bevenger, Timnath Beerwerks, Timnath, CO
Mike Myers, Root Shoot Malting, Loveland, CO
Chris Schooley, Troubadour Maltings, Fort Collins, CO
Malt has been called by many the soul of beer. For the finished goodness in your glass, malt provides flavor, aroma, body, and color. It also provides several things critically intrinsic to the brewing process. These include enzymes for the mash, grain husks for the runoff, FAN for yeast health, and sugar for fermentation.
Given all of this, it is important that the brewer knows the malt has been produced to meet the required specifications. It is also important for the maltster to know that they have produced malt of sufficient quality to sell to the brewer. There are a few malt analysis labs around the U.S. that help with this effort, and the data they collect is communicated through a document called the Certificate of Analysis (C of A). While the C of A can be overwhelming, it contains a trove of valuable information.
Many things on the C of A are simply go / no-go specifications. Others can be used to fine-tune a recipe or brewing process to create the beer you want to serve your patrons. This article is meant to help you read and evaluate a Certificate of Analysis for a batch of malt to determine if it is up to snuff from both points of view.
Go / No-go Specifications:
- Alpha-Amylase
- Enzyme produced during malting that promotes rapid starch degradation during the mash.
- Should be greater than 40 DU (dextrinizing units).
- Active while mashing in the brewing process between 149F-162F and pH from 5.3-5.8.
- Beta-Glucan
- Measure of residual cell wall components in wort and endosperm modification.
- Higher levels can lead to problems with lautering and filtration.
- It is possible to work around high beta glucan with multiple steps in the mash, be it through double infusion or triple decoction or something as old school as a turbid mash.
- Should be less than 175 mg/L.
- Diastatic Power
- Total activity of starch degrading enzymes, mainly beta-amylase.
- Decreases rapidly with increasing kiln temperatures.
- Should be greater than 125L (degrees Lintner) for most base malt, but some higher kilned base malts such as English Pale or Golden Promise can be in the 70L-100L range.
- Fine vs Coarse Extract
- Large difference is an indication of poor modification during malting.
- Difference should be less than 2.0%.
- Free Amino Nitrogen (FAN)
- FAN is the product of protein breakdown during the germination step of malting which provides nutrients for the yeast during fermentation.
- FAN concentration in wort varies with specific gravity and adjunct concentration in the malt bill.
- Too little FAN can lead to fermentation issues such as under-attenuation and sulfur off-flavor production.
- Too much FAN can lead to haze and diacetyl production thus increasing the spoilage rate of a beer, possibly leading to shelf-life issues.
- Should be greater than 150 mg/L.
- Kolbach Index
- Ratio of soluble protein to total protein (S/T).
- Poor head retention if too low.
- Poor clarity if too high.
- Should be 38%-45%.
- Ratio of soluble protein to total protein (S/T).
- Soluble Protein
- Dissolved protein in wort by weight.
- Should be 4.5%-5.5%.
Critical Process Dials:
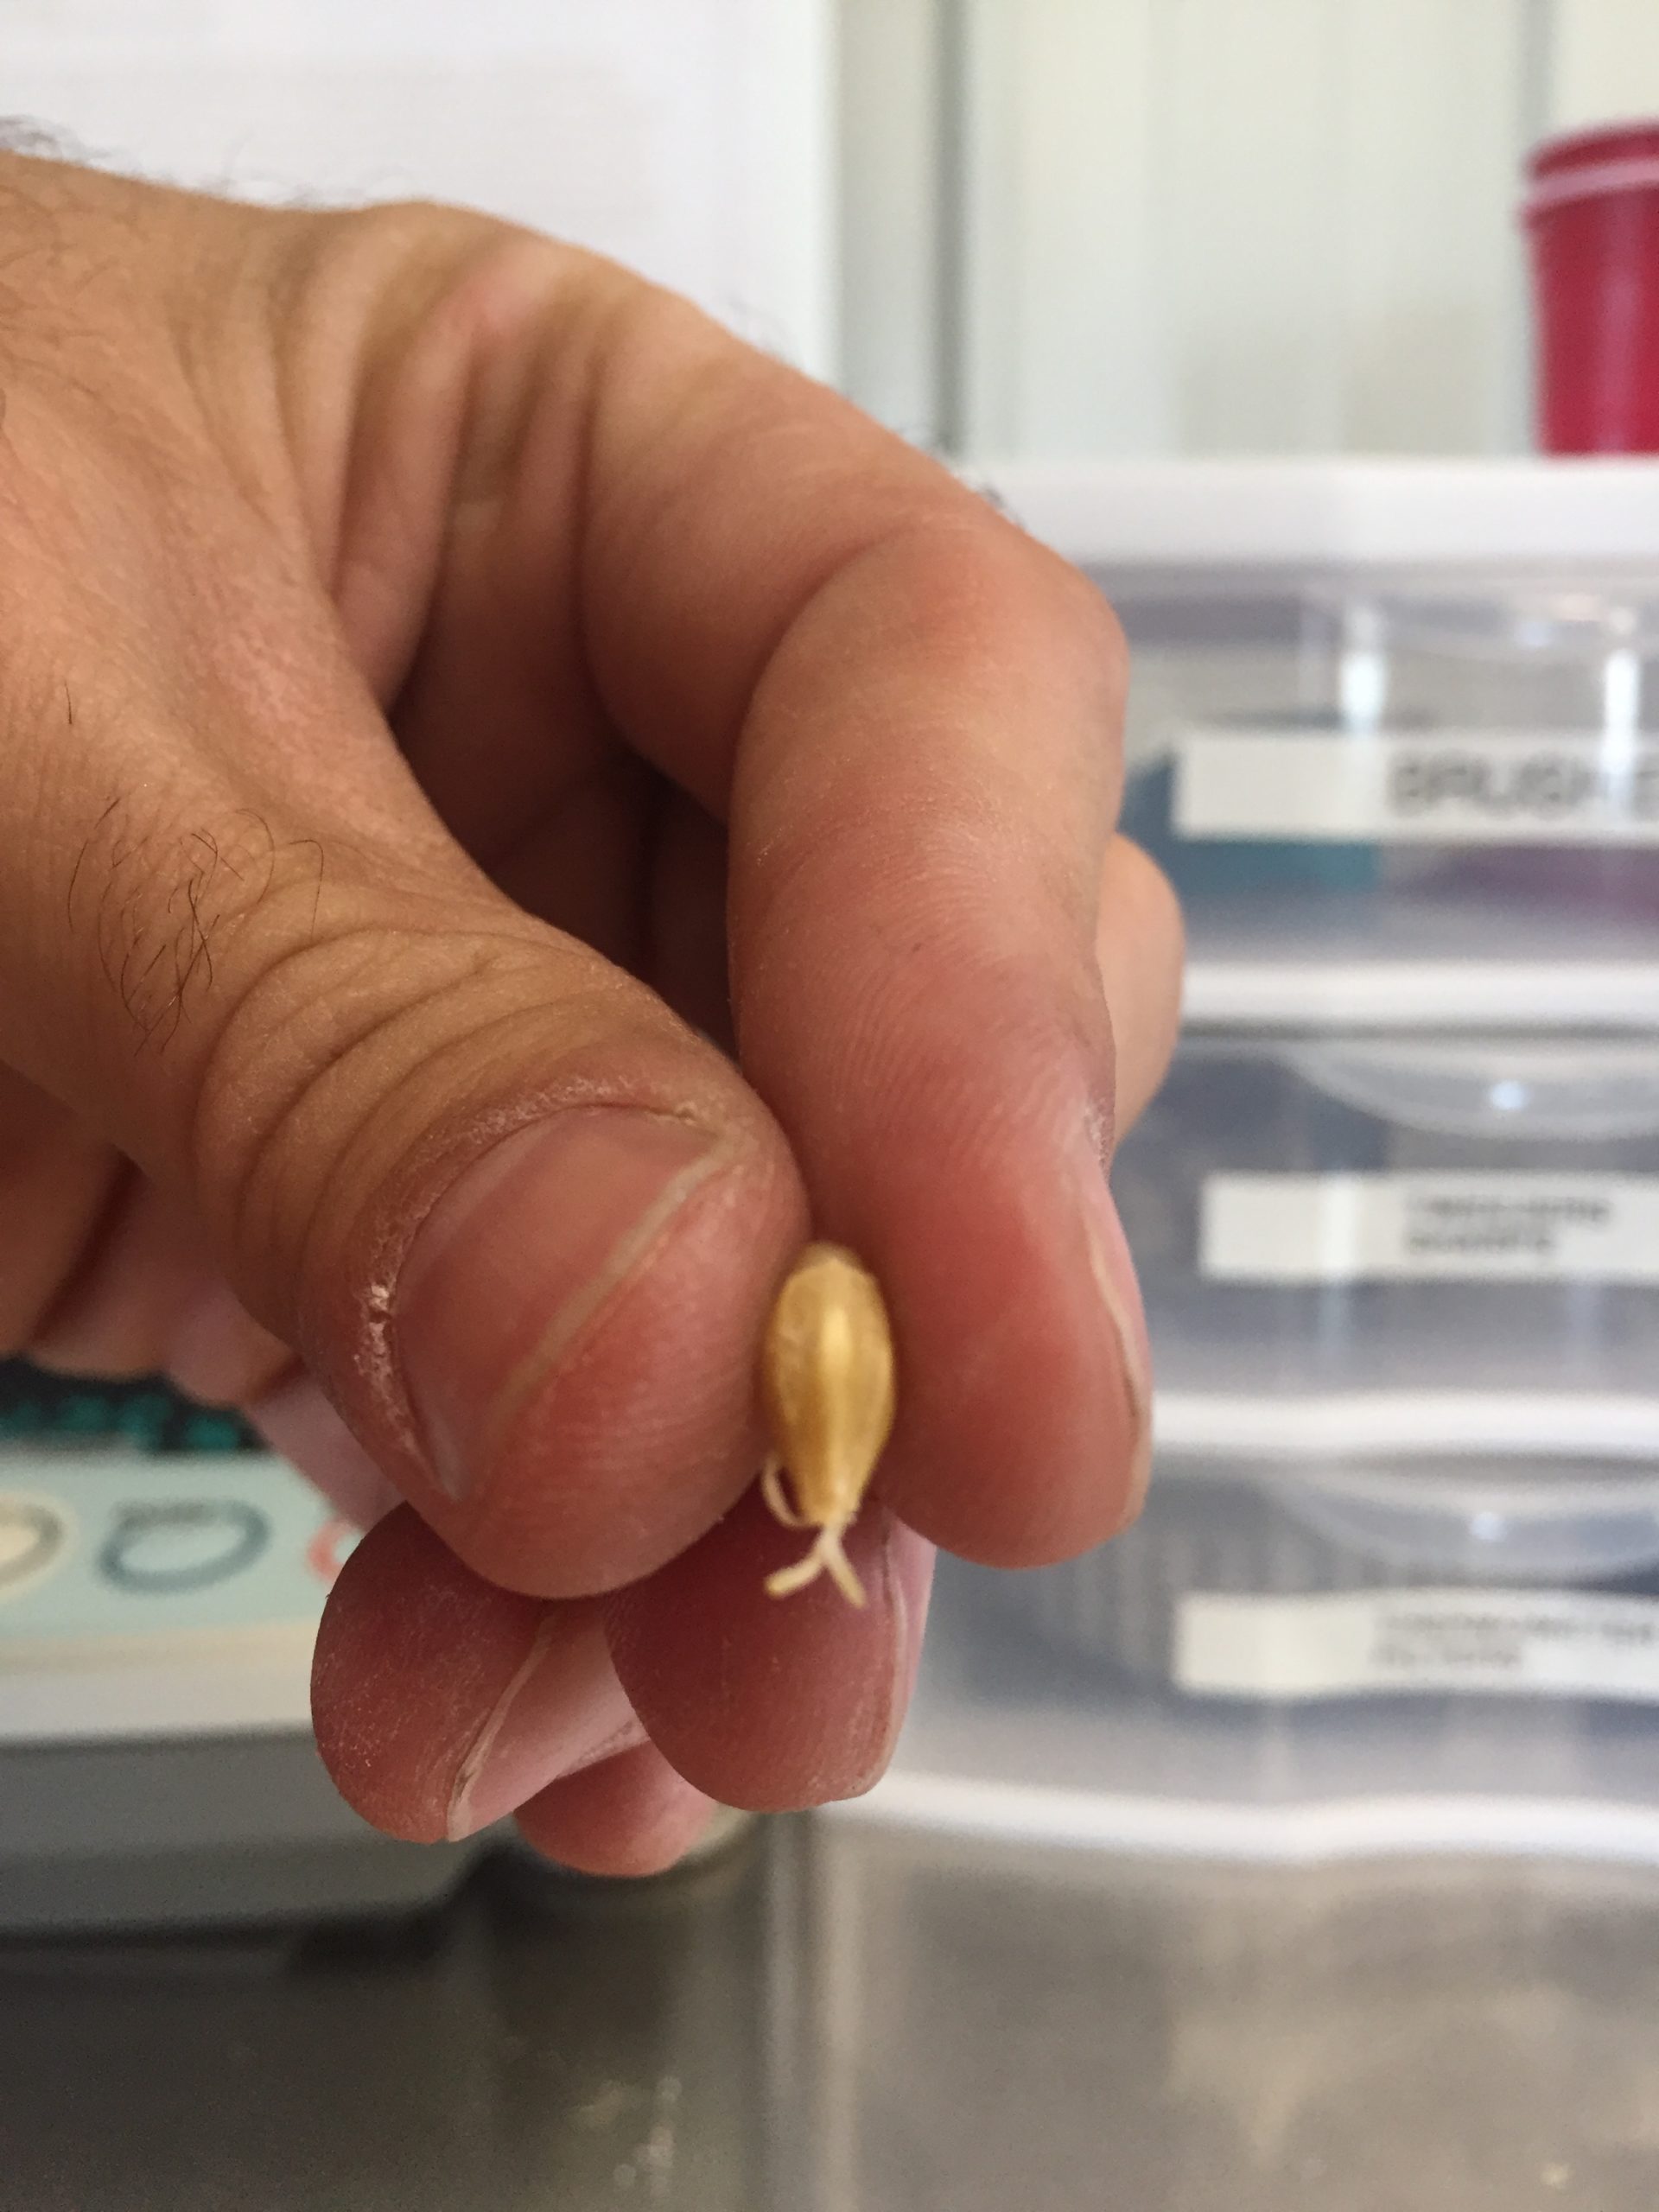
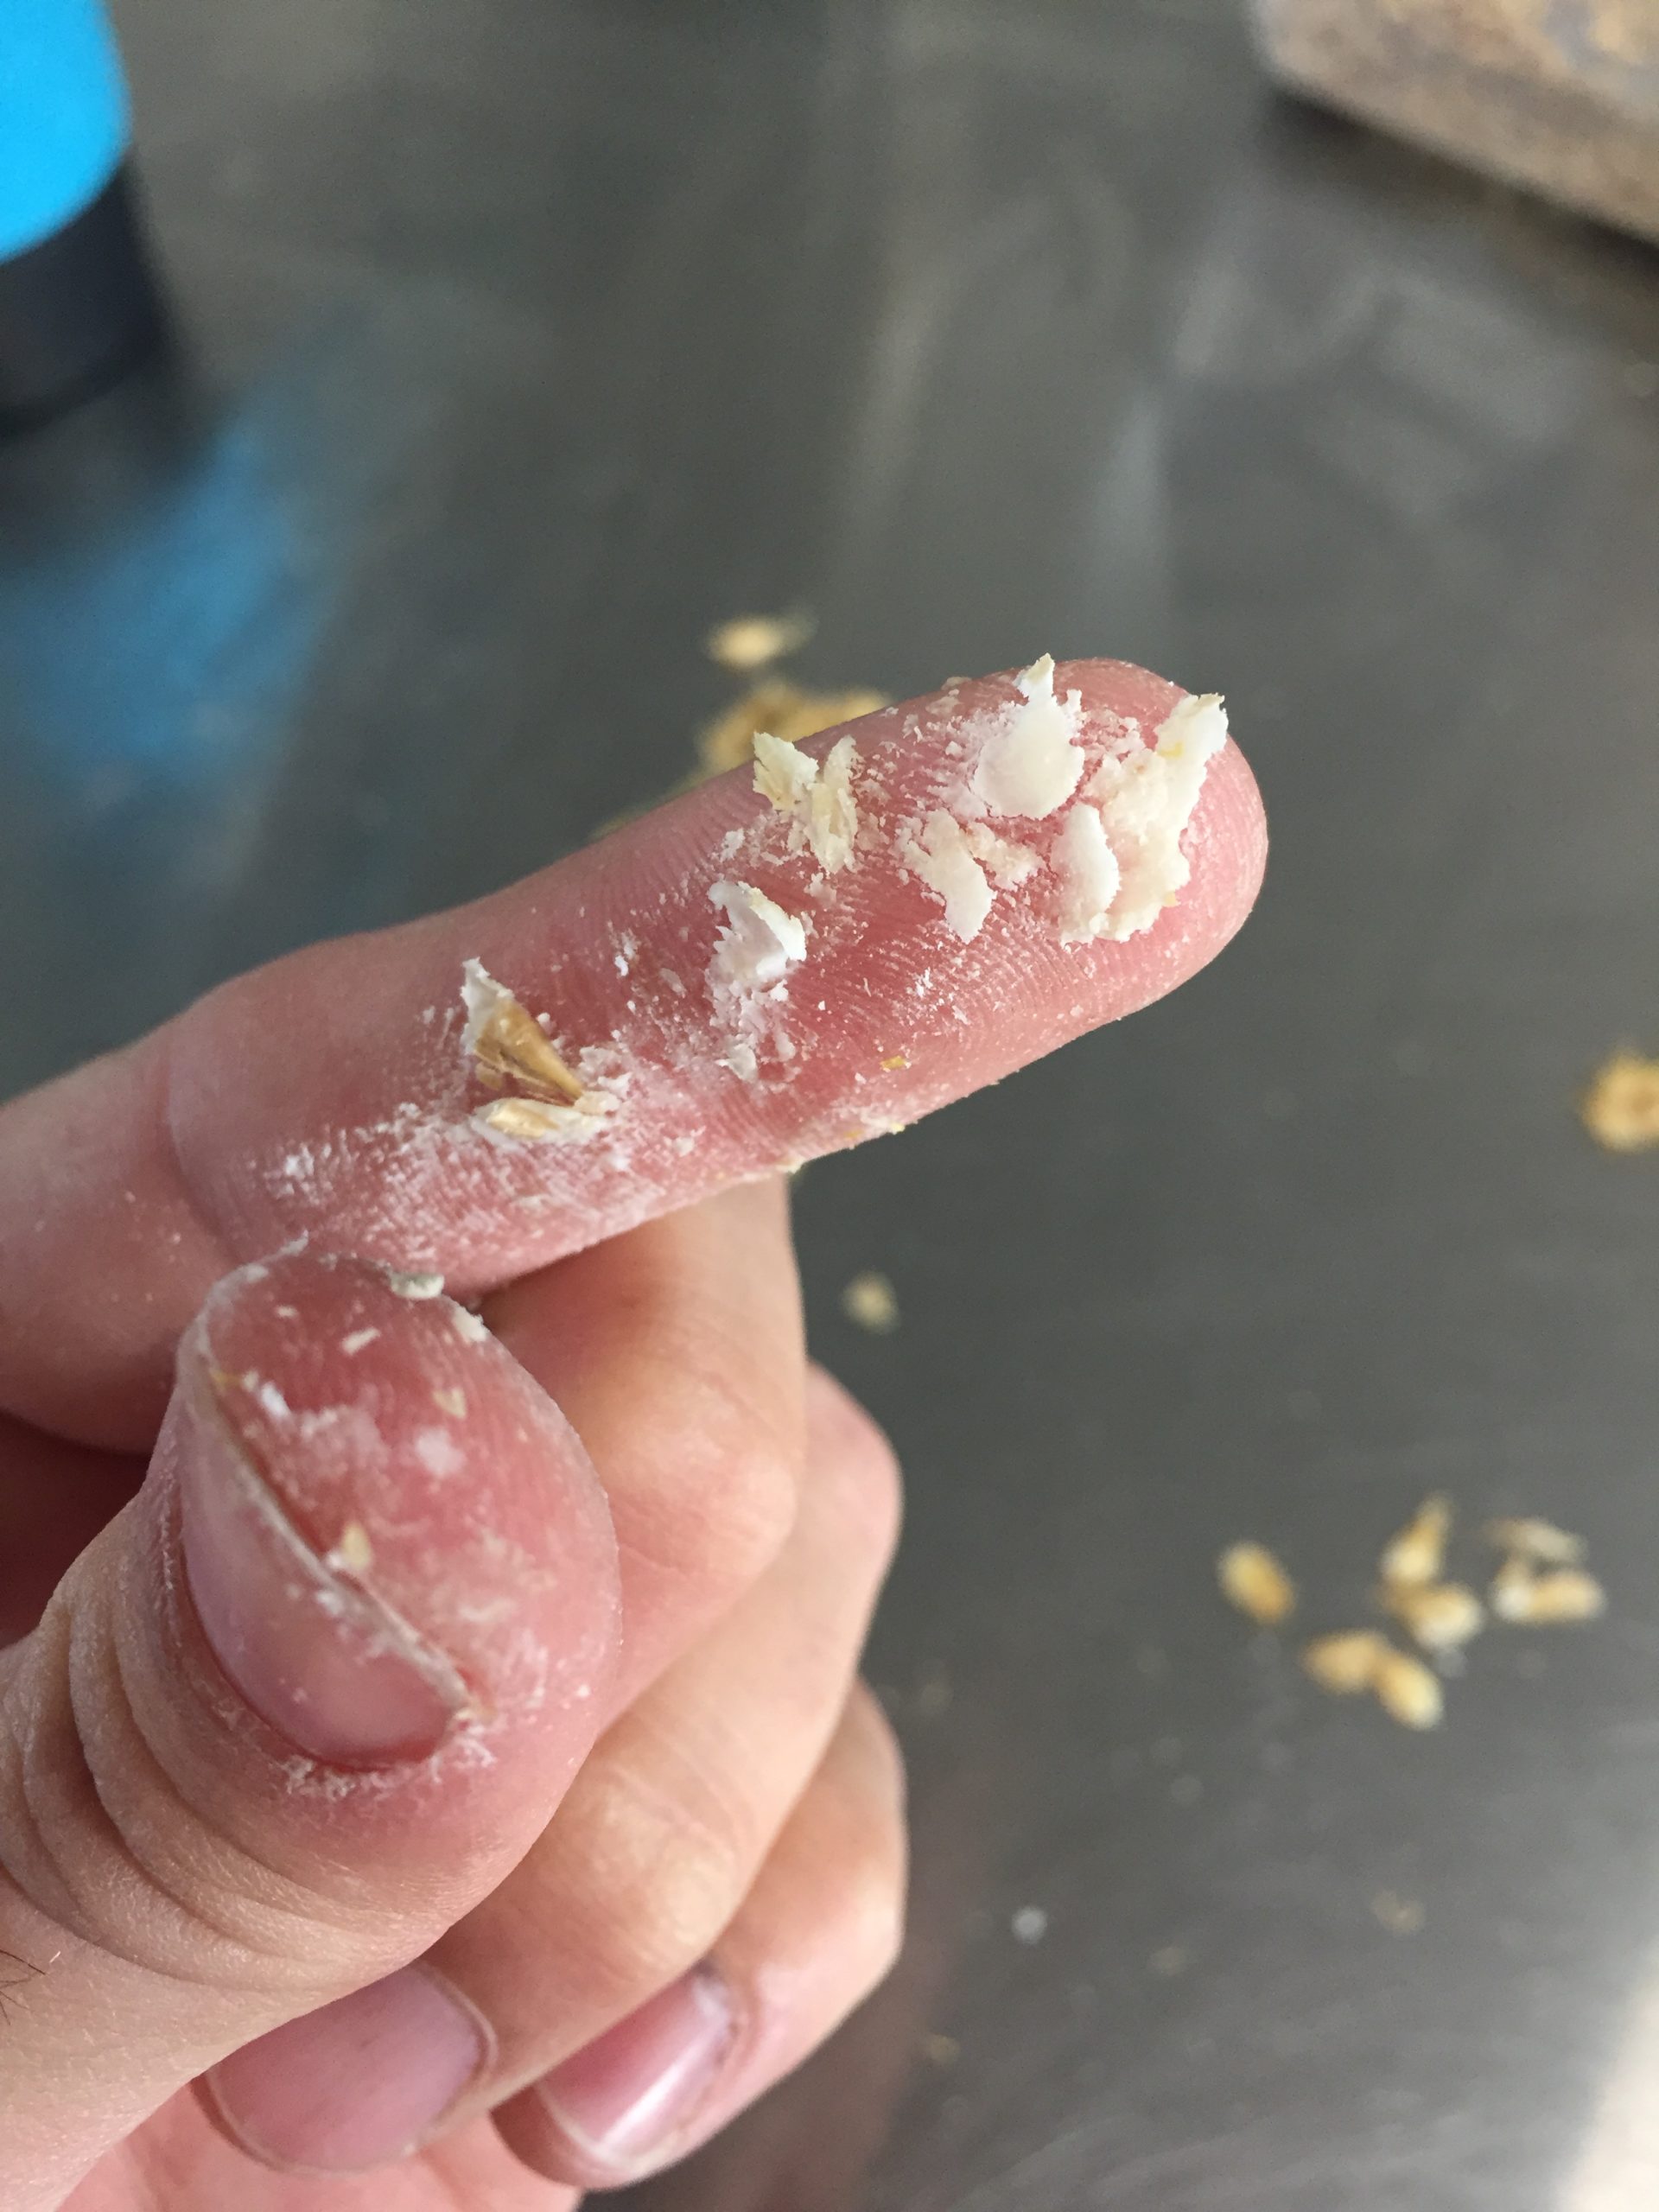
Friability is a measure of a grain’s resistance to being broken, or how crushable it is. It is important because it tracks how well the malting process produces modified malt that contains easily accessible starches to the brewer. It balances kernel hardness (and how said kernel crushes) against moisture content to ensure a successful mash step while brewing.
- Base malt friability should be over 80% with less than 1% dead or glassy kernels.
- Higher friability is an indication of how much of the barley was germinated after steeping and can lead to higher extract potential in the brewing process.
- If kernel hardness is:
- Too high, or “glassy”, the mill can produce too much flour and lead to a stuck mash. This can also be an indication of improper modification, namely excess caramelization of base malt which can lead to low enzymatic activity.
- Too low, or “slack”, the kernel is simply flattened in the mill leading to difficulty in accessing and converting the starch contained within resulting in low mash efficiency.
- If moisture content is:
- Too high, the grain can be slack, and possibly mold prior to being used in brewing.
- Too low, the grain can be glassy.
Extract is a measure of the amount of sugar that can be taken from the malt during the mash. It is related to friability in that if the inside of the kernel is not accessible during the crush, the extract will be too low. This relates directly to yield and efficiency in the brewhouse. Extract analysis is done under laboratory conditions with 1# of malt in 1 gallon of wort. It is calculated using both a dry basis coarse grind and a dry basis fine grind (DBCG, and DBFG, respectively).
- Two-row malt should have extract over 80% DBFG.
- Specialty malt extract varies widely and generally decreases as color increases.
- DBCG, or dry basis coarse grind, is a good measure of the extract that can be achieved in the brewhouse.
- DBFG, or dry basis fine grind, is the maximum extract that can be achieved under laboratory conditions.
- To calculate the wort gravity that you can expect from a given malt, use the equation:
- °P = (DBCG – MC – 0.002) X Brewhouse Efficiency X 11.486.
- MC is moisture content (%).
- The factor 11.486 normalizes extract to sucrose.
- A difference between DBCG and DBFG of more than 2.0% is an indication of poor modification during the malting process.
- Extract is negatively correlated to protein, and the ratio of soluble protein to total protein (the Kolbach Index) strongly impacts how a beer looks, smells, and tastes.
- S/T < 38% can lead to poor head retention.
- S/T > 45% can lead to clarity issues.
- °P = (DBCG – MC – 0.002) X Brewhouse Efficiency X 11.486.
Development of color in malt is achieved through the kilning and sometimes roasting during the malting process. Color (and flavor) are fundamentally tied to the time and temperature at which the malt is dried after germination is complete. Larger malthouses can blend various products to hit a spec of say 60L on a crystal malt. You can see this by checking out the distribution of kernel colors in a bag of C60. Smaller craft maltsters typically do not blend products. They would prefer to work directly with you to adjust your recipe to meet your color and flavor targets.
- Base malt is kilned at low temperature to reduce moisture content to 3%-6% by weight.
- Higher temperatures (and kilning times) lead to caramelization, toasting, and roasting of the sugars, starches, and proteins within the malt kernel.
- Note that the enzymes within the malt are degraded with increased kilning and roasting.
- Malt color is measured spectrophotometrically at 430nm using a Congress Wort (essentially a hyper-filtered steep sample).
- Most base malt is below 5 degrees Lovibond (or SRM).
- Once caramelization and higher roasting steps are performed, the color of malt can range from 3L to more than 500L.
In conclusion, the C of A is the story of a barley’s journey through the malting process. Each data point helps paint a picture of part of that journey. Some are specifically for the maltster to use, and others for the brewer. Use the C of A to start a conversation with your maltster to dial in a property of the beer you are working to perfect, then move on to the next. Whatever you do, ask for a C of A!